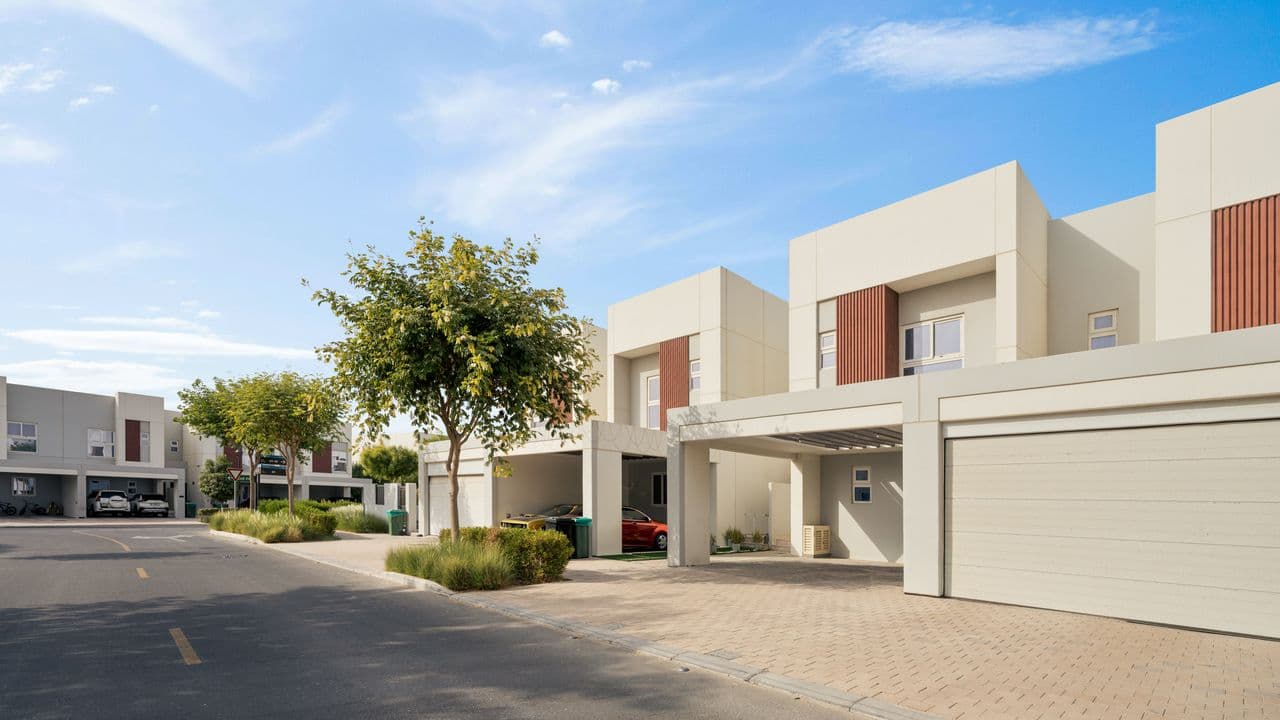
Townhomes receive less attention in many investment discussions than detached single-family homes and condominiums, but their suitability depends on local rents, purchase prices, HOA obligations, insurance, and the legal ownership structure of the specific community. Some investor guides use an 8% to 12% cash-on-cash return as a screening benchmark, but actual townhome returns vary materially by financing, HOA costs, insurance, taxes, vacancy, maintenance, and local rents. That range is a rule of thumb for what investors may consider a good result, not a measured national outcome for townhomes.
This article is a research framework rather than a performance ranking. Publicly available market data does not currently provide a consistent, townhome-specific dataset covering sale prices, rents, HOA costs, vacancy, insurance, and returns across every market discussed below. Where broad figures appear here, they are labeled by property type, geography, and observation period so you can see exactly what is being measured.
Platforms like mogul make it possible to access fractional real estate investing without the capital and day-to-day management requirements of purchasing an entire property. mogul is a fractional real estate platform club founded by former Goldman Sachs executives, with professionally vetted and managed single-family rentals at the center of its offerings.
Disclaimer: The information provided in this guide is for educational purposes only and does not constitute financial, tax, or legal advice. Always consult with a licensed professional before making any financial or investment decisions.
Key Takeaways
Midwest markets like Indianapolis and Cleveland combine lower entry prices with comparatively strong gross rental yield indicators. ATTOM's 2026 single-family rental report estimates a 9.5% gross yield for three-bedroom single-family rentals in Cuyahoga County, Ohio, and Zillow's June 2026 Indianapolis figures imply a broad price-to-rent proxy of roughly 7.24%. These are county-level single-family and all-home figures, not townhome yields.
Maintenance responsibility in a townhome community depends on the legal structure and the governing documents, not on the building type. Some townhome communities are fee-simple with owner-maintained roofs and yards, while others are organized as condominiums with association-maintained exteriors.
Sun Belt broad-market conditions softened through mid-2026. Zillow reported year-over-year typical home value declines of 2.1% in Phoenix, 2.1% in Tampa, and 1.8% in Jacksonville as of June 2026. These are all-home figures.
Property tax burdens should be underwritten at the parcel level. ATTOM's 2025 annual tax report put the Cleveland metro effective single-family rate at 1.63% and the Phoenix metro rate at 0.39%, which differ substantially from the generalized ranges commonly quoted in market roundups.
Florida and Texas do not levy a broad individual state income tax, according to the Tax Foundation's 2026 state rate data. That is one factor households and employers may weigh, but tenant stability still requires submarket-level employment, affordability, turnover, and lease-performance data.
Understanding Townhome Investment Characteristics in 2026
Where Townhomes Sit in the Residential Landscape
Townhomes occupy a middle position in the residential investment landscape, but the investment implications follow from the legal documents rather than the architecture.
Many fee-simple townhomes include individual lot ownership, while some townhome developments are legally structured as condominiums in which ownership is limited to the unit or airspace plus an undivided interest in common elements. Others sit within planned unit developments. The deed, plat, declaration, and governing documents determine what you own. Investors must review all of them before underwriting.
HOA maintenance responsibilities vary substantially for the same reason. Some condominium-style townhome associations maintain roofs, exterior walls, foundations, and common landscaping. In fee-simple townhome communities, the owner may be responsible for the roof, exterior, yard, gutters, windows, and structural components. The governing documents allocate responsibility for:
Roof repair and replacement
Exterior walls, painting, and siding
Windows, gutters, and foundations
Landscaping and snow removal
Insurance deductibles and storm damage
Communal area upkeep
Association responsibility can make maintenance more predictable, but it does not eliminate capital risk. Owners ultimately fund association obligations through dues, reserve contributions, and special assessments, and they can still face underfunded reserves, deferred repairs, and excluded losses. Unit owner policies and association master policies cover different things, and large master-policy deductibles can be allocated back to individual owners.
The 2026 Market Context
Hybrid and remote work continue to influence demand for extra bedrooms and flexible space, but townhome demand must be evaluated locally and should not be inferred from remote-work trends alone. Zillow's 2025 renter research found that 56% of recent renters initially considered apartments, 34% considered detached single-family homes, and only 10% considered townhouses or rowhouses. Buyer preferences show a similar spread in Zillow's 2025 prospective buyer research.
Several 2026 rental-market analyses identify Midwest metros as comparatively attractive for affordability and gross rental yield, including this lender roundup of 2026 investment cities, although rankings vary by methodology and property type, and none of the widely cited rankings is townhome-specific.
For investors evaluating specific properties, mogul's investment property calculator analyzes any U.S. address and reports ROI, IRR, MOIC, and cash-on-cash yield across comparison scenarios.
Defining the Return Metrics Before You Compare Markets
Market roundups frequently blur two different numbers. Keep them separate:
Gross rental yield \= annual scheduled rent divided by acquisition price.
Cash-on-cash return \= annual pre-tax cash flow after operating expenses and debt service, divided by total cash invested.
A 7% gross yield is not a 7% cash-on-cash return. Converting one into the other requires assumptions for vacancy, property management, HOA fees, repairs and capital expenditures, taxes, insurance, financing terms, closing costs, initial rehabilitation, and cash reserves. Two further metrics belong in any underwriting model: net operating income, which is gross income less operating expenses before debt service, and cap rate, which is net operating income divided by price.
The widely cited market yield figures are gross measures, and they differ in what they cover. ATTOM's county-level estimates are specific to three-bedroom single-family rentals, while price-to-rent proxies built from broad market data cover all property types. Both are useful for screening. Neither is a return.
10 Markets to Research for Townhome Investment Opportunities in 2026
The markets below are presented without ordinal ranking. A defensible ranking would require the same observation month, the same geography type, townhome-only sale prices, townhome-only market rents, a common gross-yield calculation, consistent parcel-level tax data, HOA and insurance cost distributions, and vacancy assumptions for every market. That dataset does not exist in the public sources available for this article.
Midwest Markets
Indianapolis, IN
Broad all-home typical value (Zillow, June 2026): $233,826 | Average rent: $1,411 | Implied gross price-to-rent proxy: approximately 7.24%
Broad Indianapolis price-and-rent data imply gross yields in the 7% range before expenses. Zillow's Indianapolis home value data produces roughly 7.24%, and the price and rent figures published by Norada imply approximately 7.36%. Both are all-property measures. A townhome-specific yield requires property-level rent, HOA, tax, insurance, vacancy, and financing data.
Employment fundamentals are documented. Eli Lilly committed an additional $4.5 billion across its Indiana manufacturing operations in May 2026, bringing its Indiana manufacturing commitments since 2020 to more than $21 billion.
Submarkets to research: Carmel, Fishers, and Greenwood, suburban areas with townhome developments near employment hubs.
Tax note: Indiana's frequently cited 2% figure is a constitutional liability cap for qualifying non-homestead residential property, not an ordinary local effective rate. The current tax bill and expected post-sale assessed value determine the burden on any specific parcel.
Underwriting considerations rather than market facts: Layout preferences, tenant profiles, and HOA fee levels vary by community. HOA dues are set at the association level and are reflected in current resale disclosures and listings, so a regional range is not a reliable proxy.
Cleveland, OH
County three-bedroom SFR gross yield (ATTOM, 2026): 9.5% for Cuyahoga County
ATTOM's 2026 single-family rental report estimated a 9.5% gross yield for three-bedroom single-family rentals in Cuyahoga County. That is a county-level single-family estimate and should not be presented as a Cleveland townhome yield or as a uniform metro comparison against other markets.
What the data supports:
FHFA's Cuyahoga County house price index rose from 96.08 in 2015 to 185.83 in 2025, approximately 93% cumulative appreciation, or roughly 6.8% annualized before transaction costs and without isolating townhomes.
Cleveland Clinic is a major Cleveland and Ohio employer, alongside University Hospitals.
Census QuickFacts reports a 41.7% owner-occupied housing unit rate for Cleveland during 2020 to 2024, implying approximately 58% renter-occupied units. A high renter share does not by itself prove low vacancy, credit quality, rent growth, or demand for townhomes specifically.
Tax note: ATTOM's 2025 annual tax report put the Cleveland metro effective single-family tax rate at 1.63% and the Ohio statewide rate at 1.32%. The actual parcel bill governs at the property level.
Kansas City, MO
Broad all-home typical value (Zillow, June 2026): $257,356 | Average rent: $1,444 | Implied gross price-to-rent proxy: approximately 6.73%
Current broad-market Kansas City data imply a gross price-to-rent ratio of roughly 6.7% before operating costs, according to Zillow's June 2026 figures, which also show a one-year home value change of about 1.2%. The price and rent figures published by Norada imply approximately 6.67%. These are all-property figures and cannot be relabeled as townhome performance.
Submarkets to research: Overland Park, Lenexa, and Lee's Summit, suburban communities near healthcare and technology employers, including Hallmark, which is headquartered in Kansas City.
Sun Belt Markets
Phoenix, AZ (East Valley)
Broad all-home typical value (Zillow, June 2026): $410,222 | Average rent: $1,569 | Implied gross price-to-rent proxy: approximately 4.59%
Zillow's June 2026 Phoenix data show typical home values down 2.1% year over year and average rents down 0.3%, producing a broad gross proxy below 5%. The $380,000 to $450,000 price range and 5.0% to 6.5% yield range that circulate for this market come from an analysis of targeted three-bedroom single-family rentals, not townhomes.
Population growth continues but has slowed. Phoenix metro added approximately 85,000 residents from 2023 to 2024, and the latest Census estimates show growth of 59,065 residents from July 2024 to July 2025, approximately 1.14%.
Employment drivers: TSMC's announced U.S. investment program totals approximately $165 billion, centered on its Arizona manufacturing complex, and Intel has continued major Arizona fabrication investment. Distinguish announced commitments from realized employment.
Submarkets to research: Gilbert, Chandler, and Mesa, East Valley communities with master-planned townhome stock.
Tax note: ATTOM reported a 0.39% Phoenix metro effective single-family rate and a 0.43% Arizona statewide rate for 2025, below the ranges commonly quoted.
Risk note: Phoenix avoids direct coastal hurricane exposure, but flash-flood and drainage risk remain property-specific concerns. Maricopa County maintains an active flood control district because washes, monsoon rainfall, and drainage hazards affect properties, and FEMA emphasizes that all flood zones carry some risk.
Tampa, FL
Broad all-home typical value (Zillow, June 2026): $380,283 | Average rent: $1,999 | Implied gross price-to-rent proxy: approximately 6.31%
Current broad-market and single-family datasets place Tampa gross rental yield closer to roughly 6% to 7% before expenses. Zillow's June 2026 data produce a 6.31% proxy, with typical home values down 2.1% and average rents down 0.9% year over year. Norada's published price and rent figures imply approximately 6.16%, and ATTOM's county estimate for three-bedroom single-family rentals in Hillsborough County is 7.2%.
Florida also does not levy a broad individual income tax, per the Tax Foundation. mogul's guide to real estate investing in Florida covers market fundamentals across the state.
Submarkets to research: Westchase, New Tampa, and Brandon.
Insurance and HOA note: Insurance and HOA costs are set at the property and association level. Underwriting should separately model the unit policy, master-policy allocation, wind deductible, flood coverage, reserve contributions, and potential assessments. Florida's Office of Insurance Regulation treats comparison figures as illustrative, and Citizens' approved 2026 rate and rule changes differ by policy type, including condominium-association and wind-only coverage. Florida's consumer resources on recent property insurance changes provide additional state-level background.
Jacksonville, FL
Broad all-home typical value (Zillow, June 2026): $287,871 | Average rent: $1,600 | Implied gross price-to-rent proxy: approximately 6.67%
Jacksonville remains less expensive than several major Florida metros, but broad 2026 data imply gross yields in the high-6% to low-7% range before expenses. Zillow's June 2026 figures produce approximately 6.67%, with typical home values down 1.8% year over year, while Norada's published price and rent figures imply approximately 7.04%. Broad medians differ meaningfully across sources, with one lender roundup citing a figure near $302,000. None of these is townhome-specific.
On appreciation, FHFA's all-home Jacksonville MSA index rose from 307.23 in Q1 2021 to 467.22 in Q1 2026, approximately 52%. The Q1 2020 to Q1 2025 comparison produces approximately 61.5%. Neither is a townhome-specific measure.
The Port of Jacksonville drives logistics employment, and area Navy installations contribute military-family tenant demand. Population growth has been modest: Census QuickFacts shows the city moving from approximately 1,009,833 to 1,017,689 residents, about 0.78%.
Professional and Technology Employment Markets
Charlotte, NC
Broad all-home typical value (Zillow, June 2026): $399,434 | Average rent: $1,746 | Implied gross price-to-rent proxy: approximately 5.25%
Broad Charlotte price-and-rent data imply gross yields near 5.2% before costs. Zillow's June 2026 data produce approximately 5.25%, with typical home values down 1.1% year over year. Norada's published price and rent figures imply approximately 5.18%.
Competition indicators depend on provider and geography and are not forecasts of appreciation. Zillow reported 29.1% of Charlotte sales above list in its May data, while Redfin reported 22.7% above list for a comparable period.
Employment anchors are documented: Bank of America's principal executive offices are in Charlotte, alongside Wells Fargo operations and a growing technology presence.
Submarkets to research: South Charlotte, Ballantyne, and University City.
Raleigh-Durham, NC
Broad all-home typical value, Raleigh (Zillow, June 2026): $436,056 | Average rent: $1,579 | Implied gross price-to-rent proxy: approximately 4.35%
The $350,000 to $420,000 price range and 5.0% to 6.5% yield range often quoted for this market describe targeted three-bedroom single-family rentals, not townhomes. Zillow's June 2026 Raleigh data imply a gross price-to-rent ratio closer to 4.35% before expenses, with typical values down 2.1% year over year and average rents up 0.1%.
Census estimates show Raleigh-Cary grew from 1,558,927 to 1,595,720 between July 2024 and July 2025, approximately 2.36%. Active construction and submarket-level supply still require careful analysis, and the same Flat Fee Landlord analysis describes a meaningful new-construction pipeline, so the region should not be described as free of supply pressure.
On employers: Duke, UNC-Chapel Hill, and NC State anchor education and research employment. Apple maintains a Triangle workforce, but construction of its planned permanent campus had not begun as of April 2026, and its North Carolina job-creation deadline was extended by four years in late 2025. Treat the campus as a future demand factor rather than an operating one.
Submarkets to research: Cary, Apex, and Holly Springs near Research Triangle Park.
Texas Markets
Dallas-Fort Worth, TX
County three-bedroom SFR gross yield (ATTOM, 2026): 7.3% for Tarrant County, down from 7.8%
The price and rent figures published by Norada imply approximately 5.88% gross yield for the broad DFW measure, while ATTOM estimates 7.3% for three-bedroom single-family rentals in Tarrant County. Neither is a townhome yield, and Dallas city figures differ from metro figures, so mixing city and metro measurements will distort comparisons.
Growth is well documented with current dates: DFW added approximately 123,557 residents from July 2024 to July 2025, the second-largest numerical metro increase in the country, and grew about 11% from April 2020 to July 2025. Corporate relocations, including Toyota's North American headquarters, State Farm, and CBRE, continue to draw high-income households, and Texas does not levy a broad individual income tax.
For additional context on Texas, mogul's guide to real estate investing in Texas discusses statewide investment fundamentals and selected conditions in Dallas, Houston, and Austin, including rental demand, pricing, population growth, and several mogul properties.
Tax note: Texas property tax burdens are meaningful, but generalized ranges are not a substitute for the current parcel bill and reassessment rules. Apartment supply also varies sharply by submarket.
Houston, TX
Broad all-home typical value (Zillow, June 2026): $265,010 | Average rent: $1,567 | Implied gross price-to-rent proxy: approximately 7.10%
Houston and Harris County show comparatively strong broad and single-family gross-yield indicators, but the commonly quoted $280,000 to $370,000 and 5.5% to 7.5% ranges describe targeted three-bedroom single-family rentals, not townhomes, and they do not establish a statewide first-place ranking. Zillow's June 2026 Houston data produce a broad proxy of approximately 7.10%, and ATTOM estimates an 8.0% 2026 gross yield for three-bedroom single-family rentals in Harris County.
Employment is diversified. The Texas Medical Center is commonly identified as the world's largest comprehensive medical complex, and Houston's medical, aerospace, and port sectors materially broaden the regional economy beyond energy. This supports the diversification point but does not establish townhome rents, occupancy, or returns in any specific suburb.
Submarkets to research: Katy, Sugar Land, Pearland, and League City.
Flood diligence: Construction year alone does not establish superior flood mitigation. Newer properties may have been built under updated codes, but elevation certificates, drainage design, FEMA and local maps, prior claims, finished-floor elevation, and flood insurance pricing all belong in the analysis. Treat FEMA A and V zones as high-risk and underwrite insurance, elevation, evacuation, drainage, historical losses, deductibles, and expected return accordingly. Zone X is not risk-free, because all zones carry some flood risk.
For market-specific context, mogul's Houston real estate investing guide covers neighborhood dynamics, rental-demand drivers, property types, and the renter profiles associated with selected submarkets.
Evaluating Townhome Returns: What to Expect
Understanding Return Components
Rental income, appreciation, depreciation, and leverage can all contribute to real estate returns:
Monthly rental income providing cash flow throughout the hold period
Property appreciation, which is never assured and which declined in several Sun Belt markets through June 2026
Tax treatment, including depreciation allocations whose usability depends on income, participation, and individual tax circumstances
Leverage effects, which amplify losses as well as gains
For investors analyzing specific properties, mogul's rental property calculator provides base, bear, and bull scenarios along with short-term versus long-term analysis, which helps stress-test assumptions before committing capital.
HOA Fee Impact on Net Returns
HOA fees are a critical variable, and they vary substantially by community and scope of coverage. They depend on whether exterior maintenance is included, insurance, community age, amenities, reserves, flood or wind exposure, number of units, professional management, and pending capital projects. A Florida townhome association covering roofs, exterior insurance, flood-related infrastructure, and extensive amenities is not comparable with a fee-simple community maintaining only roads and landscaping.
Regional averages are far less informative than the current budget, reserve study, insurance declarations, assessment history, and resale certificate for a specific property. Association insurance costs in particular can shift by carrier, location, construction, policy type, deductible, and loss history.
When comparing an association-maintained townhome against a self-maintained detached home, compare the present value of HOA fees and assessments with expected owner-paid maintenance over the intended holding period, accounting for component life, reserve funding, special assessments, rent differences, insurance, and opportunity cost. An association-funded roof is still funded by owners. Neither structure is inherently superior.
Why mogul Stands Out for Fractional Residential Real Estate Investors
mogul provides fractional access to professionally vetted and managed residential rental properties, reducing the capital and day-to-day management requirements associated with purchasing an entire property. Founded by former Goldman Sachs executives with more than $10 billion of deal experience, mogul applies proprietary, institutional-style underwriting informed by that background. Its portfolio includes townhome product, such as The Bowser, a four-story Dallas townhome, alongside its primary focus on single-family rentals.
What differentiates mogul:
Selective property screening means less than 1% of properties reviewed pass mogul's diligence process. The acquisitions team negotiates the purchase price, seller-paid repairs, and loan terms before placing a property under contract, a sequence covered in mogul's property onboarding process overview.
First $10k protection for new members. mogul covers up to $10,000 in losses on investments made during a new member's first seven days, measured over that first year. This allows new investors to build conviction in real estate while limiting downside exposure.
Low-friction ownership reduces the operational burden that stops most investors. There is no six-figure down payment and no 3 a.m. tenant calls, with an average investment of about $10,000 across professionally managed properties. Licensed property managers oversee routine operations and tenant coordination, while material property decisions, generally those above $1,000, may be submitted to investors for a supermajority vote through the property-specific investment club LLC structure.
Distributions and tax allocations. Once a property is operational, investors may receive monthly distributions based on their proportionate share of net rental income, in line with each property's operating results and offering terms. Investors may also receive proportionate tax allocations, including depreciation-related allocations, depending on the property and their individual tax circumstances. In short, the mogul member experience centers on monthly dividends, real-time appreciation, and the tax benefits of the asset class.
Reported performance and scale. mogul reports 18% average annual returns versus the S\&P 500's 9%, more than $40 million in assets on the platform, and more than 13,000 investors. mogul also reports that 90% of its investors invest a second time, and when they do, that second investment is on average 3x their first. Performance varies by property, market conditions, and the terms of each offering.
mogul's platform supports short-term, mid-term, and long-term rental strategies as well as sale-leasebacks. Current property and strategy availability varies by offering, and can be reviewed among mogul's current properties. The how it works page explains the process from property selection and acquisition through LLC fractionalization, holding, distributions, governance, and eventual sale, and mogul's about page covers the mission to make real estate, the world's largest wealth generator, accessible to investors. Prospective members can also book a call with the team.
Disclaimer: The information provided in this guide is for educational purposes only and does not constitute financial, tax, or legal advice. Always consult with a licensed professional before making any financial or investment decisions.
Frequently Asked Questions
How do HOA restrictions affect townhome rental investments?
Some townhome HOAs cap the percentage of units that can be rented or impose minimum lease terms. HOA documents set out rental restrictions, owner-occupancy requirements, and any pending rule changes, and some associations require board approval for tenants or restrict short-term rentals entirely. HOA financial health matters as well: reserve fund statements and the governing documents indicate whether the association can cover major repairs without special assessments that erode returns.
What insurance considerations are unique to townhome investments?
Townhome insurance depends on the community's legal structure. In condominium-style communities, the association master policy typically covers the building exterior and common areas, while the individual unit policy covers interior improvements, fixtures, and liability. In fee-simple communities, the owner may carry full structural coverage. In Florida markets, whether the master policy includes hurricane coverage, and at what deductible level, materially affects the analysis, since large deductibles and covered-versus-excluded losses can be allocated to unit owners. Some Florida associations have experienced substantial insurance increases in recent years, but changes vary by carrier, location, construction, policy type, deductible, and loss history. Citizens' approved 2026 changes differ by category, and Florida's Office of Insurance Regulation treats comparison figures as illustrative only. Several years of actual association insurance and budget records are more informative than any published range.
How does townhome appreciation compare to single-family homes over time?
Realtor.com's September 2025 analysis found national appreciation from 2014 through 2024 of 87.3% for single-family homes, 86.5% for townhomes, and 82.7% for condominiums. Townhome cumulative appreciation was therefore approximately 99% of the single-family rate nationally, not a fraction of it, though regional outcomes varied substantially and no universal ratio applies. Fee-simple land ownership may support value, but ownership structure and local supply-and-demand conditions determine appreciation, not the townhome label alone. Some townhomes are legally organized as condominiums with no individually owned lot, and the same Realtor.com data show regional conditions in which condominiums outperformed. On cash flow, townhomes may produce stronger or weaker results than detached homes depending on acquisition price, rent, HOA fees, insurance allocation, taxes, assessment risk, tenant turnover, and maintenance responsibilities. Matched properties within the same submarket are a better comparison than an assumed property-type advantage.
What tenant demographics typically rent townhomes versus apartments or single-family homes?
Potential townhome renters may include households seeking additional bedrooms, privacy, or attached-home convenience, such as young families, renters transitioning from urban apartments, downsizing households, and corporate relocators on fixed assignments. These are plausible personas rather than measured shares. Zillow's 2025 renter research found that only 10% of recent renters initially included a townhouse or rowhouse among their preferred property types, and apartments remained the dominant rental choice. Target demographics should be established using local leasing and applicant data. A property that appeals to several household types may have a broader prospect pool, but that does not by itself reduce vacancy. Expected vacancy should be based on comparable listings, lease-up time, concessions, turnover, and stabilized occupancy, and affordability remains the leading renter priority.
How do I evaluate townhome properties in markets where I don't live?
Remote townhome investing depends on systematic due diligence: comparable rents drawn from multiple data sources rather than seller projections; HOA financial health as shown in reserve studies, budgets, insurance declarations, assessment history, and meeting minutes; whether the community is fee-simple or condominium; regional construction practices; and market-specific property management considerations. Platforms like mogul reduce this operational burden, since mogul's teams conduct proprietary underwriting and licensed managers oversee routine property operations, while investors retain governance rights over material decisions.